

Smart glasses quality consistency: four measurements and what each misses
The conclusion on four measurements and no single figure
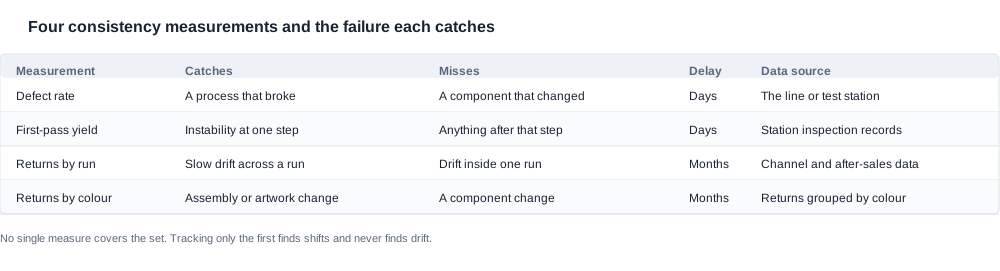
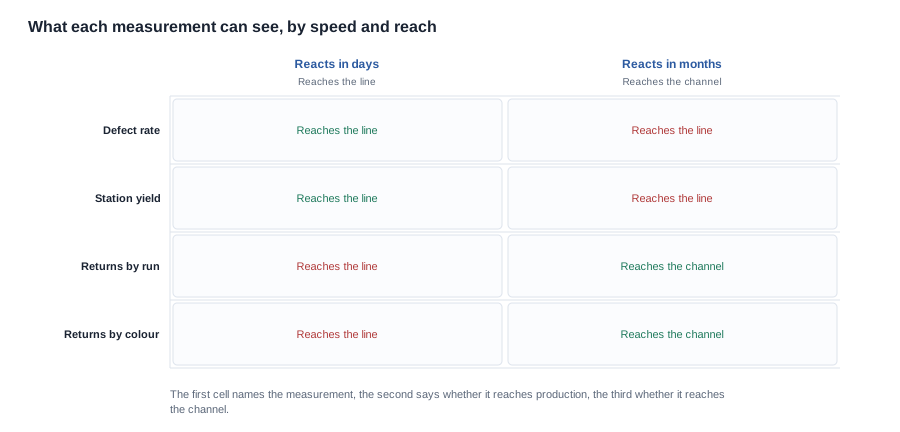
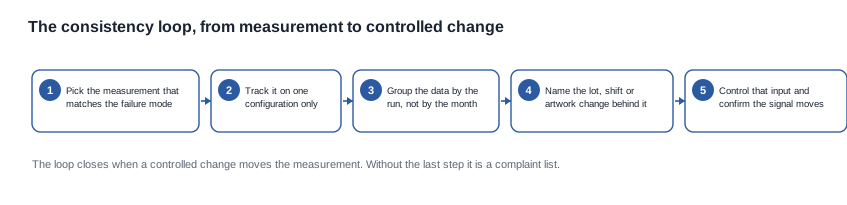
The request is usually for a single consistency figure, and the honest answer is that we do not publish one. What is more useful is showing which four measurements actually detect inconsistency, because each one catches a different class of failure and none of them catches all of them. A defect rate catches a process that broke and misses a component that changed quietly. First-pass yield by station catches instability at a specific step and misses anything downstream of that step. Returns grouped by production month catch slow drift across a run and miss a drift that stayed inside one run. Returns grouped by colourway catch assembly and artwork differences and miss a component change entirely. A programme that tracks only the first of these finds shifts and never finds drift, which is the failure mode that costs a buyer the most, because drift is the failure that does not break anything. If you want to calculate consistency in this category, the method is to pick the measurement that matches the failure you suspect, track it on one configuration only, and group the data by the run rather than by the calendar.
Who is buying, and what consistency means to them
The reader is a brand-side buyer, a channel buyer or an importer, and the situation is usually one of three. A programme has been running for some months and the channel is reporting a slow increase in complaints that nobody can reproduce. A second supplier has quoted a better price and the buyer needs to know whether the two suppliers are actually delivering the same product. Or the buyer is opening a new programme and needs to set up the acceptance criteria before the first production run, because that is the only moment at which the criteria can be agreed.
In all three cases the underlying question is the same: are the units leaving the line now the same as the units that were approved, and if not, when did they stop being the same? The last part is the one that matters at twelve months into a programme, and it is the part that a single percentage cannot answer. A consistency figure tells a buyer that two things differ; the regrouped data tells the buyer which month or which colourway or which station is responsible, and that is what makes the difference recoverable.
The quality consistency section covers the framework, and the acceptance criteria comparison covers how to compare two suppliers on it honestly.
The market backdrop: why consistency is harder here than the price
The published range is heterogeneous in a way that makes a single consistency method awkward. Twenty-eight models span camera units with 8 MP and 13 MP sensors, audio units with single cells and with two cells at 55 mAh and 90 mAh per side, sport units with different charging methods, and a small group of children's models. A yield averaged across a camera build and an audio build is an average of two different processes, and it tells the buyer nothing about either of them.
The configuration space widens it further. One camera model carries a 900 mAh or a 1400 mAh case, one has a folding case at 1200 mAh, two have a case whose capacity is not published, and one has no case at all. Colour options differ between models, and assembly steps, packaging artwork and cosmetic inspection all vary with colourway while the electronics do not. A consistency measurement that is not scoped to a configuration will produce a number that is arithmetically correct and practically useless.

What each measurement is worth once the failure mode is known
Every measurement in this section is measured against a baseline, and the baseline is the published specification. That is worth stating before any of the four, because the baseline is distributed unevenly across the range and the gaps in it are where a consistency problem hides longest. The chart below counts, across the twenty-eight models, how many carry a published row for each field.
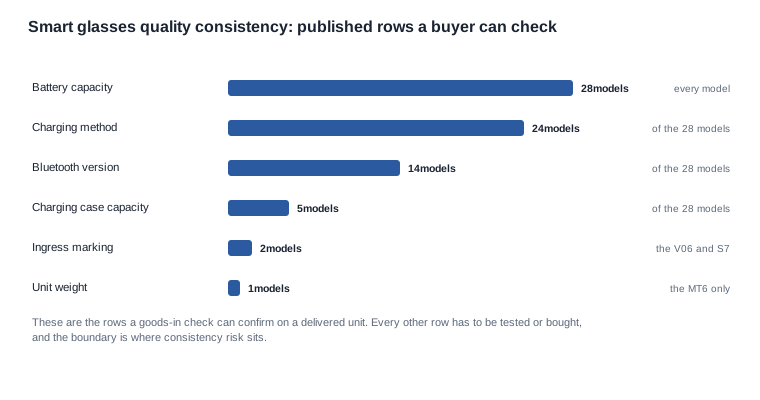
The distribution matters for consistency work in a specific way. The rows on the left are the ones a goods-in check can confirm on a consignment without asking anyone for anything, which means a configuration error or a mix-up on the packing line is caught before it reaches a channel. The rows on the right are the ones where a substitution inside a capacity tier changes nothing a buyer can see, and those are the rows that make a consistency programme expensive, because the detection arrives as a return rather than as a rejection at the gate.
Defect rate by category catches shifts, not drift
A defect rate is the measure everyone asks for first, and it is the weakest of the four for consistency specifically. It is computed over units produced and units failed, and it rises sharply when something breaks and stays flat when a component quietly changes.
Drift is precisely the failure that does not break anything. A cell swapped within a capacity tier leaves the specification rows intact. The published battery capacity, the published runtime, the published charge time and the published charging method all still describe the product correctly, because the catalogue describes the product and not the particular cell lot in this particular run. The unit passes every functional test, and it runs shorter than the one before it by a margin that only a channel would ever notice. A defect rate will never register that, because nothing failed.
The measure is still worth having, because it is the fastest signal available and it tells the buyer where to point the other three. Its weakness is that it is a lagging indicator of breakage rather than a leading indicator of variation.
First-pass yield by station is the most diagnostic
Yield per station, tracked over time, is the measure that actually locates instability. It moves before returns do, because it moves at the point where the variation is introduced rather than at the point where it becomes visible in the channel.
Track it by station rather than as a single line figure, and track the same configuration only. An average across camera and audio-only units is an average of two different processes, as noted above, and an average across a camera configuration with a case and one without a case is an average across two different packing operations. The station yield is also the measure that most directly supports a corrective action, because it names the step where the variation entered.
The practical constraint is that it requires the supplier to hold station-level records and to release them. A buyer who wants this measure has to ask for it during the contract negotiation, because it is far harder to obtain retrospectively than an aggregate figure.
Returns by production month catch slow drift
Returns are the measure with the longest feedback delay and the best coverage, because they include failures the factory cannot see: fit complaints, connection issues that appear only in normal use, and cosmetic differences a station inspection passes.
Grouping them by the month the unit was produced rather than the month it was returned is what turns this from a complaint count into a consistency signal. The regrouped version shows whether the third reorder is different from the first, which is the question that matters at twelve months into a programme. A return rate that is flat month by month on a return-date basis can still be hiding a steady monthly increase, because the products returning in month nine were made in month six.
The requirement this places on the buyer is a traceable relationship between a returned unit and the run that produced it. Without that relationship the data cannot be regrouped at all, and the buyer needs to establish it before the programme starts rather than discovering the gap when the first dispute arrives.
Return rate by colourway catches what the others miss
Colourway is an unusually good proxy in this category, because assembly steps, packaging artwork and cosmetic inspection all vary with it while the electronics do not. A colourway that returns at a higher rate is pointing at an assembly or artwork difference rather than a component one.
This is also the measure that most often surprises the factory, because it was never tracked. Splitting returns by colourway on existing data is free and can be done retrospectively, which makes it the fastest consistency check available to a buyer who already has channel data. The published range gives this measure more resolution than most categories would, because several models are published with three or four colour options and the colourways are distinguishable in the returns data.
A fourth cut worth adding: production week rather than reorder month
A fourth cut is worth adding if you have the data: returns grouped by the production week rather than the reorder month. Reorder months are coarse and will hide a drift that started and finished inside two shipments. Production weeks are finer, and the pattern that appears, a cluster of returns all traced to two consecutive weeks, usually points at a specific material lot or a specific shift rather than at a design issue.
This is the cut that converts a general observation into an actionable one, because a two-week cluster has a cause that can be looked for. It requires the run traceability described above, and it is the reason retaining production samples from each run matters as evidence rather than as a formality.
Verifying a consistency claim before you rely on it
The steps that check how a consistency figure was produced
A consistency claim is a claim about a population, so verifying it means checking how the number was produced rather than checking the number itself. Each step below has a completion test that is a document, a named owner or a retained artefact.
- Ask for the denominator, the sample size and the inspection method behind any figure. A percentage without those three cannot be checked by the buyer and therefore cannot be relied on. This is the single most important question in a consistency conversation.
- Ask how the data is grouped. Whether returns are grouped by return date or by production date changes what the figure means entirely, and the difference between the two is usually the whole finding.
- Check the configuration scope. Whether the measure covers one build or an average across several determines whether the number describes anything actionable.
- Ask what changes are recorded. A factory that tracks substitutions, artwork revisions and firmware changes can be asked why a measurement moved. A factory that does not track them can only report that it did.
- Confirm the retention position. Production samples retained per run and a signed artwork proof kept with the run file are the two artefacts that make a later dispute resolvable, and both are decided before the first run rather than after it.
The questions to ask about consistency evidence
- What is the method behind the inspection result, and what is the sample size?
- Is the data grouped by the month the unit was produced or the month it was returned?
- Is the measure taken on one configuration or across the range?
- Which process changes are recorded, and where are they kept?
- Are production samples retained per run, and for how long?
- Is the signed artwork proof kept with the run file?
- Which component substitutions have been approved since the first production run, and who signed them?
The case example shows a drift found four months late and what would have caught it earlier, and the common mistakes article covers the errors that stop a shipment.
How to read two suppliers' consistency claims against each other
Comparing two suppliers on consistency requires holding three things constant: the configuration, the measurement method and the data grouping. A defect rate from one supplier and a first-pass yield from another are not comparable, and neither is a defect rate computed on different definitions of a defect.
The more useful comparison, when two suppliers cannot be compared on figures, is on the evidence they are willing to hold. A supplier that retains production samples, records substitutions with written sign-off, keeps a corrective action log and holds a signed artwork proof has demonstrated a process, and the absence of figures is then a matter of disclosure rather than a matter of capability. A supplier that will produce a percentage but not a method has demonstrated the opposite.

The controls that protect a consistency figure once the programme is running
The controls to agree before the first production run
Consistency is not defended by a figure, it is defended by the controls that were put in place before the first run. The table below is the list, and the timing is the point: every item on it is cheap in week one and expensive in month six.
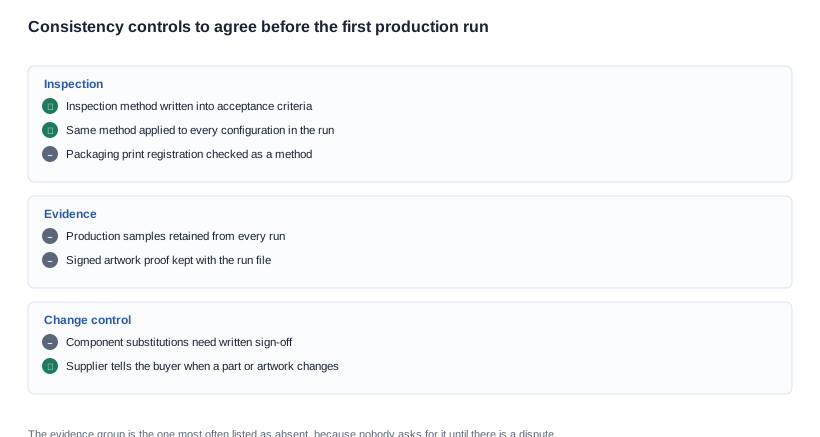
The three groups are different in kind. The inspection group is a set of decisions about how a check is performed, and it is free to agree because it only requires the parties to write down what they were already doing. The evidence group is about artefacts that have to be retained, which is a small cost per run and the difference between a resolvable dispute and an unresolvable one. The change control group is the most valuable and the most frequently missing, because a same-capacity cell swap changes the unit without changing any published row, and only a change-control process catches it.
Where a consistency programme breaks down
The average that hides two processes. A yield figure computed across camera and audio builds is reported as a single number, and it moves for reasons that have nothing to do with either build. The fix is to scope the measure to a configuration before it is reported, not after it is questioned.
The return that cannot be traced to a run. Without a link between a returned unit and the run that produced it, the regrouped analysis that would locate a drift is impossible, and the buyer is left with a complaint count rather than a signal. The fix is run traceability agreed at the start of the programme.
The specification that does not move. The published rows describe the product. A substitution within a capacity tier leaves every published row intact, so nothing built on those rows detects it and the detection arrives as a return. The fix is written sign-off on substitutions, which is the only control in this list that stops a recurring risk rather than documenting a past one.
The artwork that drifted. Print registration, colour and substrate differences are the defects customers photograph most often, and they are the most traceable, because the drift is visible in the unit and the proof is in the file. The fix is retaining the signed pre-production proof with the run file.

What the consistency conversation can and cannot be traded on
The parts worth negotiating
Consistency controls are usually agreed reluctantly, because each one costs the factory something and the buyer cannot immediately see what it buys. Three of them are worth pressing on, and the reason is that their cost falls with volume while the risk they remove does not.
The first is the corrective action log. It costs a factory an afternoon to start and nothing to maintain, and it is the only item in this list that converts a recurring finding into a closed one. A factory with a log can show a buyer that the same issue has not recurred; a factory without one can only assert that it has not.
The second is retained production samples. Two finished units per run is a small cost that scales with the number of runs, and it is the difference between a consistency claim being checkable and being merely asserted. Where the buyer has a channel relationship where returns disputes are common, this is usually the item with the highest return on the negotiation.
The third is the acceptance method, specifically the one for packaging print registration. It requires no equipment and no new process step, only a decision about how the check is performed and who performs it. It is the cheapest control available and it addresses the defect that customers most often report.
The parts that are not worth the argument
A per-unit inspection regime that exceeds what the category requires is expensive and, on the evidence of drift, less effective than the four measurements above. A supplier that installs a heavier inspection step has not necessarily improved consistency, and it has certainly added cost. The better trade is usually to hold the standard where it is and improve the traceability, so that when a problem does occur it can be found and closed.
A guaranteed consistency percentage is also not worth negotiating, and this is a point worth making to a buyer who assumes it should be. A guarantee on a figure the supplier cannot check against a method the buyer has not agreed is a promise without a measurement behind it. The measurable substitute is a clause that names the inspection method, the acceptance criterion, the retention period and the corrective action obligation, and it is a stronger protection than a percentage because it is enforceable against a defined standard.
The clause that makes the whole thing enforceable
The clause worth having in the order is not a number. It is a commitment to a method, a sample and a response time: the inspection method applied to each configuration in the run, the retention of production samples from each run, notification of any component substitution or artwork change before it is used, and a defined corrective action for any finding above the agreed acceptance criterion. That clause is worth more than any published figure, because it is the thing a buyer can actually point to when the channel starts complaining.
The boundary of what we publish on smart glasses quality consistency
What we do not publish and why
We do not publish a defect rate, a yield figure or a consistency percentage, and all of them are not published in our documentation, not because the work is not done, but because a percentage without the denominator, the sample size and the inspection method behind it cannot be checked by the buyer and therefore cannot be relied on. Publishing one would create a figure that reads as a guarantee and cannot act as one, and a buyer who built a claim on it would find the error in the channel rather than in the file.
We also do not publish a frame weight for most models, and we would rather tell the buyer that than quote a typical figure they cannot verify. The published rows that do exist are the specification ones: battery capacity, runtime, charge time, charging method, Bluetooth version where the catalogue states it, charging case capacity where it is stated, the ingress marking on the V06 and the S7, and the 158 g weight of the MT6 glasses body including the cell and the camera and excluding the folding case.
Inspection method, retained samples and the artwork proof
We will agree an inspection method and an acceptance criterion with the buyer before production, retain samples from each run, keep the signed artwork proof with the run file, and tell the buyer when a component or a version of the artwork changes, because those are the things that actually move the consistency signal whether or not the number is published. We will also say plainly which of the four measurements we can produce for a given configuration and which the buyer's own channel data has to supply.
Configuration, volume and destination market
Send the model, the configuration, the volume and the destination market, and we will tell you which of the four measurements can be produced for that build, what the acceptance criteria would need to say, and which consistency risks sit outside anything the factory controls.
Send the configuration and the volume, and we will say which consistency measurement fits that build and which risks sit with the channel instead.